Basics
This page is meant as a fast guide for these who already know about NURBS.
If you don’t feel confident, please go to Get started
Construct a BSpline curve
To define a curve, you need:
one
knotvector, which tells thedegreeandnptsof the curvenumber of points (
npts) control points
You can use the GeneratorKnotVector to help you create the knotvector.
As direct example, we present a simple code to plot a spline curve
import numpy as np
from pynurbs import GeneratorKnotVector, Curve

# Define the knotvector (0, 0, 0, 0.5, 1, 1, 1)
knotvector = GeneratorKnotVector.uniform(degree = 2, npts = 4)

# Create curve instance
curve = Curve(knotvector)

# Create the control points
ctrlpoints = [(2, 4), (1, 1), (3, 2), (0, 3)]

# Set curve's control points
curve.ctrlpoints = np.array(ctrlpoints)
Warning
The control points must support the linear operations:
sum of two points:
point0 + point1multiplication by an scalar:
scalar * point
As example, (2, 4) is a tuple hence 1.5 * (2, 4) is not valid and raises TypeError.
In the code above we converted the points to numpy.array to allow such operations.
Evaluating curve points
To evaluate the curve points, you can call the curve as a function or use the eval function.
Use curve(nodes) is the same as curve.eval(nodes)
import numpy as np
from matplotlib import pyplot as plt
from pynurbs import GeneratorKnotVector, Curve

# Create the curve
knotvector = GeneratorKnotVector.uniform(2, 4)
ctrlpoints = np.array([(2, 4), (1, 1), (3, 2), (0, 3)])
curve = Curve(knotvector, ctrlpoints)

# Evaluate points to plot curve
uplot = np.linspace(0, 1, 129)
points = curve(uplot)  # Shape (129, 2)

# Plot the points
xplot = [point[0] for point in points]
yplot = [point[1] for point in points]
plt.plot(xplot, yplot, color="b")

# Mark the control points
xvertices = [point[0] for point in curve.ctrlpoints]
yvertices = [point[1] for point in curve.ctrlpoints]
plt.plot(xvertices, yvertices, marker=".", ls="dotted", color="r")

# Add grid and show image
plt.grid()
plt.show()

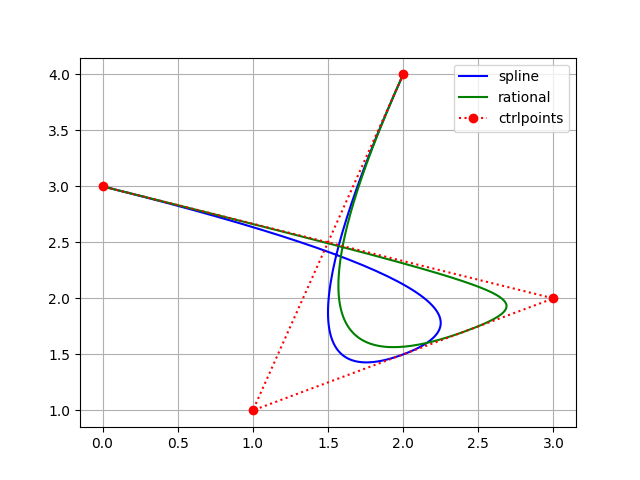
Construct a rational bspline curve
The steps to construct a rational bspline curve is the same as to construct a bspline curve, but we set the attribute weights
import numpy as np
from matplotlib import pyplot as plt
from pynurbs import GeneratorKnotVector, Curve

knotvector = GeneratorKnotVector.uniform(2, 4)
ctrlpoints = np.array([(2, 4), (1, 1), (3, 2), (0, 3)])
curve = Curve(knotvector, ctrlpoints)

# From spline to rational bspline
curve.weights = [1, 2, 5, 1]
Insert and remove knots
Two of the main features are knot_insert and knot_remove, which don’t modify the curve
import numpy as np
from pynurbs import GeneratorKnotVector, Curve

knotvector = GeneratorKnotVector.uniform(2, 4)
ctrlpoints = np.array([(2, 4), (1, 1), (3, 2), (0, 3)])
curve = Curve(knotvector, ctrlpoints)

print(curve.knotvector)  # (0.0, 0.0, 0.0, 0.5, 1.0, 1.0, 1.0)
curve.knot_insert([0.2, 0.2, 0.5, 0.7])
print(curve.knotvector)  # (0.0, 0.0, 0.0, 0.2, 0.2, 0.5, 0.5, 0.7, 1.0, 1.0, 1.0)
curve.knot_remove([0.2, 0.5, 0.7])
print(curve.knotvector)  # (0.0, 0.0, 0.0, 0.2, 0.5, 1.0, 1.0, 1.0)
Trying to remove non-possible knots raises a ValueError
import numpy as np
from pynurbs import GeneratorKnotVector, Curve

knotvector = GeneratorKnotVector.uniform(2, 4)
ctrlpoints = np.array([(2, 4), (1, 1), (3, 2), (0, 3)])
curve = Curve(knotvector, ctrlpoints)

print(curve.knotvector)  # (0.0, 0.0, 0.0, 0.5, 1.0, 1.0, 1.0)
curve.knot_remove([0.5])
# ValueError: Cannot update knotvector cause error is  6.00e-01 > 1e-09
It’s possible to force knot removal by changing the value of tolerance or setting it to None (infinite tolerance)
import numpy as np
from pynurbs import GeneratorKnotVector, Curve

knotvector = GeneratorKnotVector.uniform(2, 4)
ctrlpoints = np.array([(2, 4), (1, 1), (3, 2), (0, 3)])
curve = Curve(knotvector, ctrlpoints)

print(curve.knotvector)  # (0.0, 0.0, 0.0, 0.5, 1.0, 1.0, 1.0)
curve.knot_remove([0.5], tolerance = None)

Degree increase and decrease
Other two of the main features are degree_increase and degree_decrease which modifies the polynomial degree without changing the curve
import numpy as np
from pynurbs import GeneratorKnotVector, Curve

knotvector = GeneratorKnotVector.uniform(2, 4)
ctrlpoints = np.array([(2, 4), (1, 1), (3, 2), (0, 3)])
curve = Curve(knotvector, ctrlpoints)

print(curve.degree)  # 2
curve.degree_increase()
print(curve.degree)  # 3
curve.degree_decrease()
print(curve.degree)  # 2
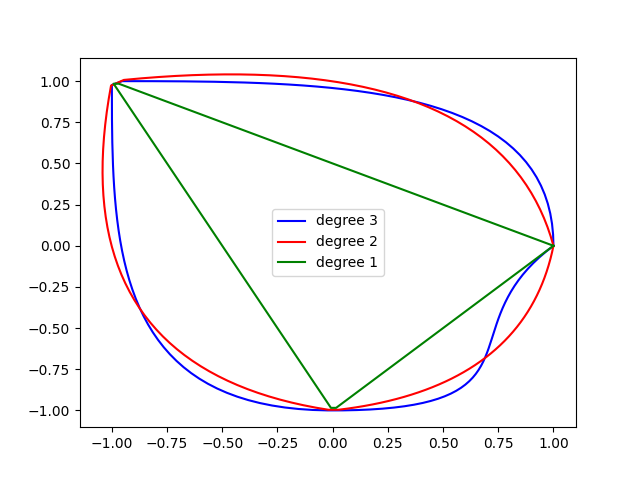
Trying to decrease a non-possible degree raises a ValueError for given tolerance.
You can also change the value of tolerance or set it to None (infinite tolerance)
import numpy as np
from pynurbs import GeneratorKnotVector, Curve

knotvector = [0, 0, 0, 0, 1/3, 1/3, 1/3, 2/3, 2/3, 2/3, 1, 1, 1, 1]
ctrlpoints = [(1, 0), (1, 1), (0, 1), (-1, 1), (-1, 0),
            (-1, -1), (0, -1), (1, -1), (0.5, -0.5), (1, 0)]
curve = Curve(knotvector, np.array(ctrlpoints))  # Blue

curve.degree_decrease(times = 1)
# ValueError: Cannot update knotvector cause error is  1.04e-02 > 1e-09

curve.degree_decrease(times = 1, tolerance = None)  # Red

curve.degree_decrease(times = 1, tolerance = None)  # Green
Clean curve
It’s possible to use knot_clean, degree_clean and clean to reduce to minimum the number of control points of the curve.
It’s usefull when there are unecessary knots caused by knot insertion or degree increase.
import numpy as np
from pynurbs import GeneratorKnotVector, Curve

knotvector = GeneratorKnotVector.uniform(2, 4)
ctrlpoints = np.array([(2, 4), (1, 1), (3, 2), (0, 3)])
curve = Curve(knotvector, ctrlpoints)

curve.degree_increase(2)
print(curve.degree)  # 4
curve.degree_clean()
print(curve.degree)  # 2

curve.knot_insert([0.25, 0.75])
print(curve.knotvector)  # (0.0, 0.0, 0.0, 0.25, 0.5, 0.75, 1.0, 1.0, 1.0)
curve.knot_clean()
print(curve.knotvector)  # (0.0, 0.0, 0.0, 0.5, 1.0, 1.0, 1.0)
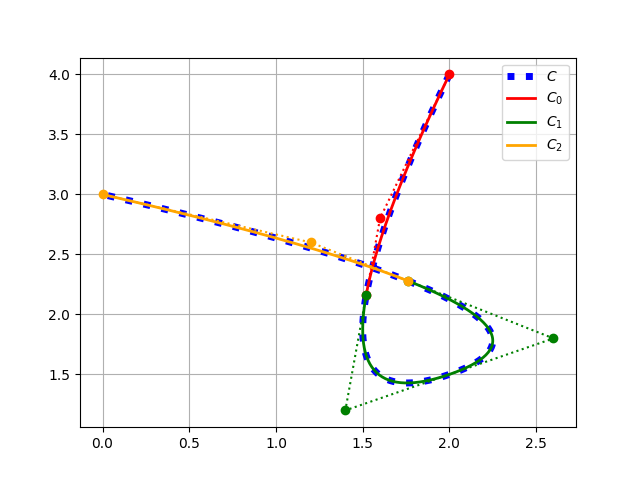
Split and unite
It’s possible to split and unite curves.
import numpy as np
from pynurbs import GeneratorKnotVector, Curve

knotvector = GeneratorKnotVector.uniform(2, 4)
ctrlpoints = np.array([(2, 4), (1, 1), (3, 2), (0, 3)])
curve = Curve(knotvector, ctrlpoints)

subcurves = curve.split([0.2, 0.8])
print(len(subcurves))  # 3
print(subcurves[0].knotvector)  # (0.0, 0.0, 0.0, 0.2, 0.2, 0.2)
print(subcurves[1].knotvector)  # (0.2, 0.2, 0.2, 0.5, 0.8, 0.8, 0.8)
print(subcurves[2].knotvector)  # (0.8, 0.8, 0.8, 1.0, 1.0, 1.0)

original_curve = subcurves[0] | subcurves[1] | subcurves[2]
print(original_curve.knotvector)  # (0.0, 0.0, 0.0, 0.5, 1.0, 1.0, 1.0)
Note
Unite curves A and B requires that max(A.knotvector) = min(B.knotvector)
The operation A | B calls knot_clean for the knot max(A.knotvector)
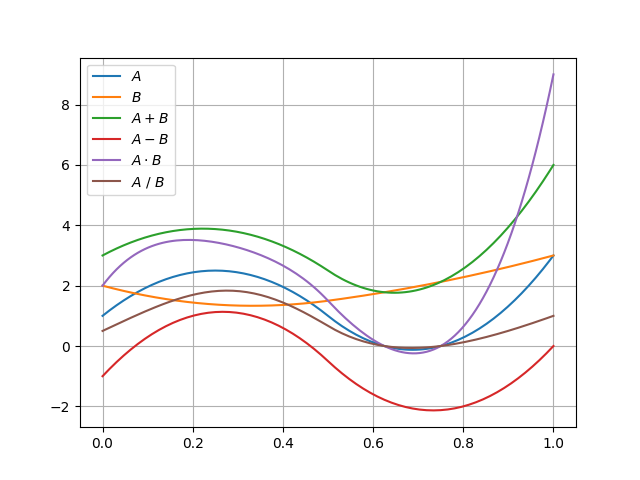
Mathematic operations
The Curve’s objects allow operations using the symbols +, -, *, / and @.
from pynurbs import GeneratorKnotVector, Curve

knotvector = GeneratorKnotVector.uniform(2, 4)
curveA = Curve(knotvector, [1, 4, -2, 3])
curveB = Curve(knotvector, [2, 1, 2, 3])

AaddB = curveA + curveB
AsubB = curveA - curveB
AmulB = curveA * curveB
AdivB = curveA / curveB
# AmatB = curveA @ curveB
Warning
To use such operations, the operation between two points must be defined:
A + Bis already a base conditionA - Bonly ifpointA - pointBis definedA * Bonly ifpointA * pointBis definedA / Bonly ifpointA / pointBis definedA @ Bonly ifpointA @ pointBis defined
The operation A / B may cause ZeroDivisionError if B has roots in the interval.
Fitting
The Curve’s objects has the functions fit_curve, fit_function and fit_points.
from pynurbs import Curve

# Create knot vector
knotvector = (0, 0, 0.5, 1, 1)

# Create curve with no control points
curve = Curve(knotvector)

# Define the function to fit
function = lambda x: 1 + x**2

# Use fit_function
curve.fit(function)

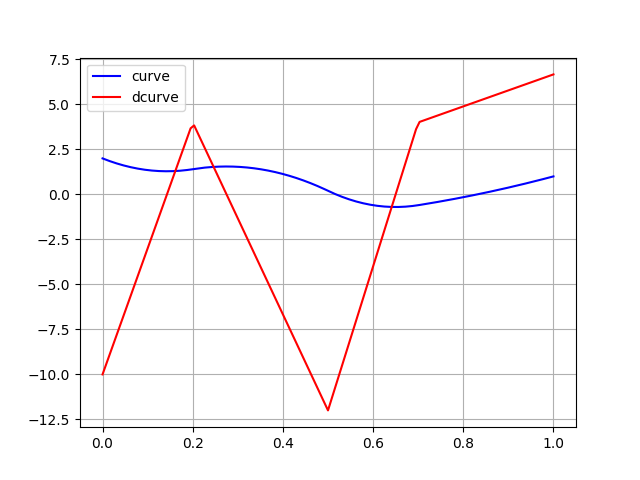
Derivative
It’s possible to derivate a curve
from pynurbs import Curve
from pynurbs.calculus import Derivate

# Create knot vector
knotvector = (0, 0, 0, 0.2, 0.5, 0.7, 1, 1, 1)

# Create control points
ctrlpoints = (2, 1, 2, -1, 0, 1)

# Create curve
curve = Curve(knotvector, ctrlpoints)

# Derivate
dcurve = Derivate(curve)

print(dcurve)
# Spline curve of degree 1 and 5 control points
# KnotVector = (0, 0, 0.2, 0.5, 0.7, 1, 1)
# ControlPoints = [-10.0, 4.0, -12.0, 4.0, 6.67]
Projection of a point in curve
Finds the parameter \(u^{\star}\) such \(\|\mathbf{C}(u^{\star})-\mathbf{P}\|\) is minimal. Since it’s possible to have more than one parameters \(u^{\star}\) with equal distance, the function returns a tuple of parameters.
from pynurbs import Curve, Projection

# Create knot vector
knotvector = (0, 0, 0, 0.2, 0.5, 0.7, 1, 1, 1)

# Create control points
ctrlpoints = [(2, 1), (2, -1), (0, 1), (-1, 2), (-1, -2), (1, -2)]
ctrlpoints = np.array(ctrlpoints)

# Create curve
curve = Curve(knotvector, ctrlpoints)

# Point we want to find the parameter
point = (0, 0)

# Projection
param = Projection.point_on_curve(point, curve)
print(param)  # (0.2950247530811703, )

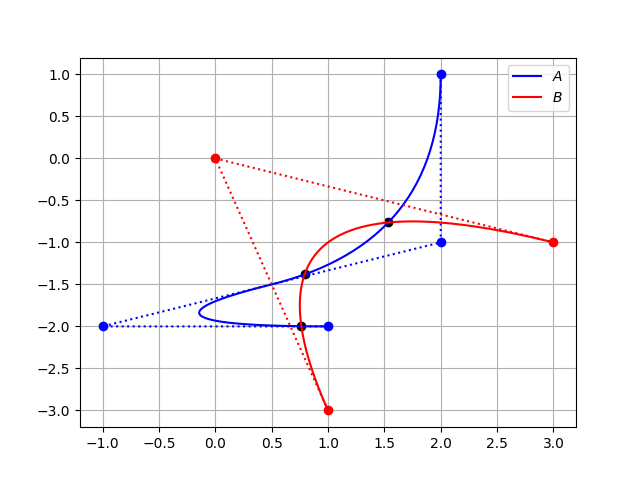
Intersection of two curves
Finds all the pairs \(\left(u^{\star}, \ v^{\star} \right)\) such \(\|\mathbf{C}(u^{\star})-\mathbf{D}(v^{\star})\| \le TOL\)
import numpy as np
from pynurbs import Curve
from pynurbs.advanced import Intersection

# Create first curve
pointsa = [(2, 1), (2, -1), (-1, -2), (1, -2)]
curvea = Curve((0, 0, 0, 0.5, 1, 1, 1),
               np.array(pointsa))

# Create second curve
pointsb = [(1, -3), (0, 0), (3, -1)]
curveb = Curve((0, 0, 0, 1, 1, 1),
               np.array(pointsb))

# Intersections
params = Intersection.curve_and_curve(curvea, curveb)
print(params)  # ((0.4487, 0.3527), (0.9688, 0.1914), (0.2786, 0.6928))